
Your Postgres dashboards got slow. Postgres, DuckDB or ClickHouse?
What each engine does with an analytics query, what we measured on our own hardware, and the migration mistake that silently loses rows.
The situation
You have a Postgres database behind a product, and it has done everything well for years: users, accounts, orders, sessions. Then someone adds a dashboard. Daily active users for the last 30 days. Events per kind per week for six months. The 95th-percentile latency per endpoint.
The tables those dashboards read are the append-heavy ones: events, request logs, audit trails. They grow by millions of rows a month. The dashboard that took 300 ms in the first quarter now takes 20 seconds, the read replica is pinned at 100% CPU every time someone opens it, and the "just add an index" tickets stopped helping a while ago.
This article is about that moment. There are three serious options people reach for: stay on Postgres, add DuckDB, or move the event tables to ClickHouse. We'll go through how each one actually executes an analytics query, what we measured ourselves (including where our numbers are weak), when each one is the right answer, and the migration trap we hit, where rows go missing with no error anywhere.
Why the same query is slow in one engine and fast in another
Postgres: a row store with MVCC
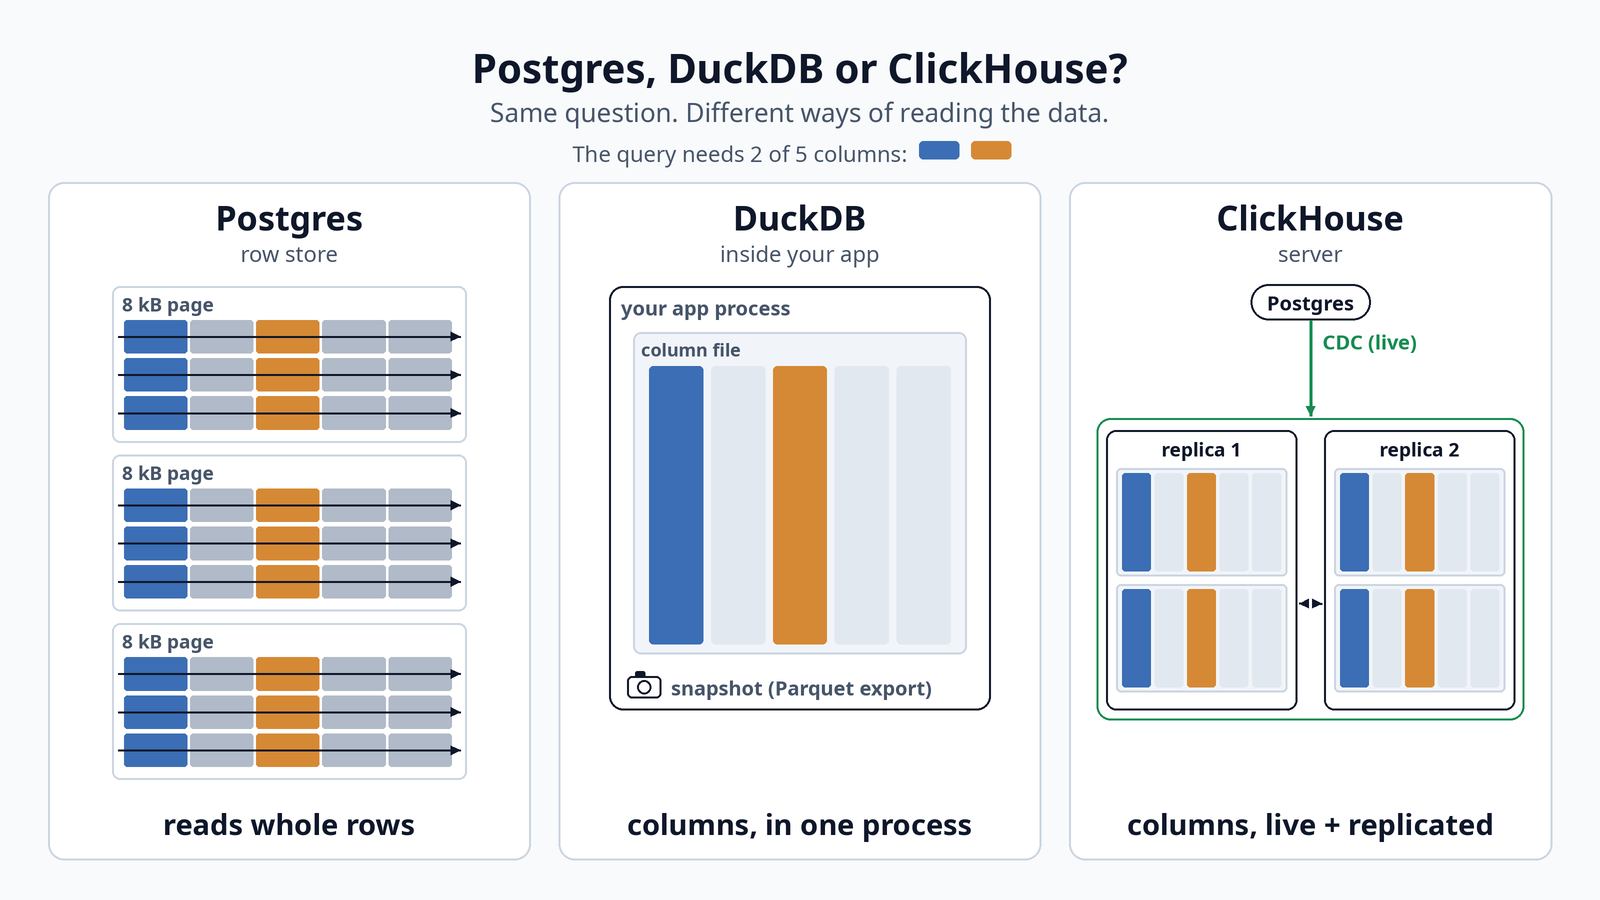
Postgres stores each table as a heap of 8 kB pages, and each page holds whole rows (tuples) (docs). That's ideal for "fetch this order with all its fields", and it's why Postgres is so good as a transactional database.
An analytics query is the opposite shape. "Count distinct users per day over 30 days" needs two columns out of maybe twenty, across millions of rows. In a row store, Postgres still reads the pages that contain the whole rows, so most of the bytes it reads from disk or cache are columns the query never uses.
MVCC adds to that. An UPDATE in Postgres writes a new version of the row and leaves the old one for VACUUM to reclaim later (MVCC, VACUUM). Visibility is checked per tuple. That's the price of excellent concurrent transactions, and an aggregation over a big table pays it on every row.
Postgres can split one query across workers (parallel query), but the number of workers per query is capped by settings such as max_parallel_workers_per_gather, which defaults to 2 (docs, setting). It also has real tools for analytics: BRIN indexes for naturally ordered time columns, declarative partitioning so a 30-day query skips old partitions, and materialized views for precomputed rollups (BRIN, partitioning, materialized views). Columnar storage exists, but only as an extension (for example Citus columnar), not in core Postgres.
DuckDB: a columnar engine inside your process
DuckDB is an analytical database that runs inside the application that uses it: a Python notebook, a CLI or a backend service. In its normal mode there is no server to install (why DuckDB, connecting). It stores and processes data by column and executes queries in vectors, batches of values from one column at a time, which is what modern CPUs are good at (why DuckDB).
For our dashboard query, that means it reads only the user_id and ts columns, compressed, and pushes thousands of values at a time through each operator.
Two properties shape where it fits:
- Concurrency. Within one process, many threads can read and write. Across processes, either exactly one process opens the database read-write, or several open it read-only and nobody writes (concurrency). That's perfect for one analyst or one service, and a poor fit for 50 dashboard users hitting a shared server.
- Getting data in. DuckDB can query (and write) Postgres tables directly through its
postgresextension, and it reads Parquet files natively (postgres extension, Parquet). So you can point it at a replica or an export without building a pipeline first.
DuckDB is MIT-licensed. The core intellectual property and trademarks are held by the non-profit DuckDB Foundation (foundation, FAQ). It is not an Apache project.
ClickHouse: a columnar server built for many concurrent queries
ClickHouse is a column-oriented database server (intro). Its main table engine family is MergeTree: inserts are written as immutable "parts", sorted by the table's ORDER BY key, and parts are merged in the background (MergeTree). A sparse primary index lets a query skip whole ranges of rows, and each column is compressed on its own (LZ4 by default when self-hosted, ZSTD by default on ClickHouse Cloud, plus specialised codecs) (codecs).
Two details matter for anyone coming from Postgres:
- Replication is per table, through ReplicatedMergeTree and a coordination service, ClickHouse Keeper (replication).
- Updates and deletes are not OLTP operations. With ReplacingMergeTree, an update is a new row version, and duplicates are only collapsed when parts merge, at a time you don't control. To get exact results before that, a query adds
FINAL, which costs time (ReplacingMergeTree). Deletes are either a heavyweight mutation or a lightweight delete that marks rows (mutations, DELETE). Our numbers below show that cost.
ClickHouse is a server you run (or buy as a service), with its own memory needs. Its own guidance recommends 32 GB of RAM or more, and warns that below 16 GB you may hit memory exceptions (usage recommendations). It is open source under the Apache 2 license (history).
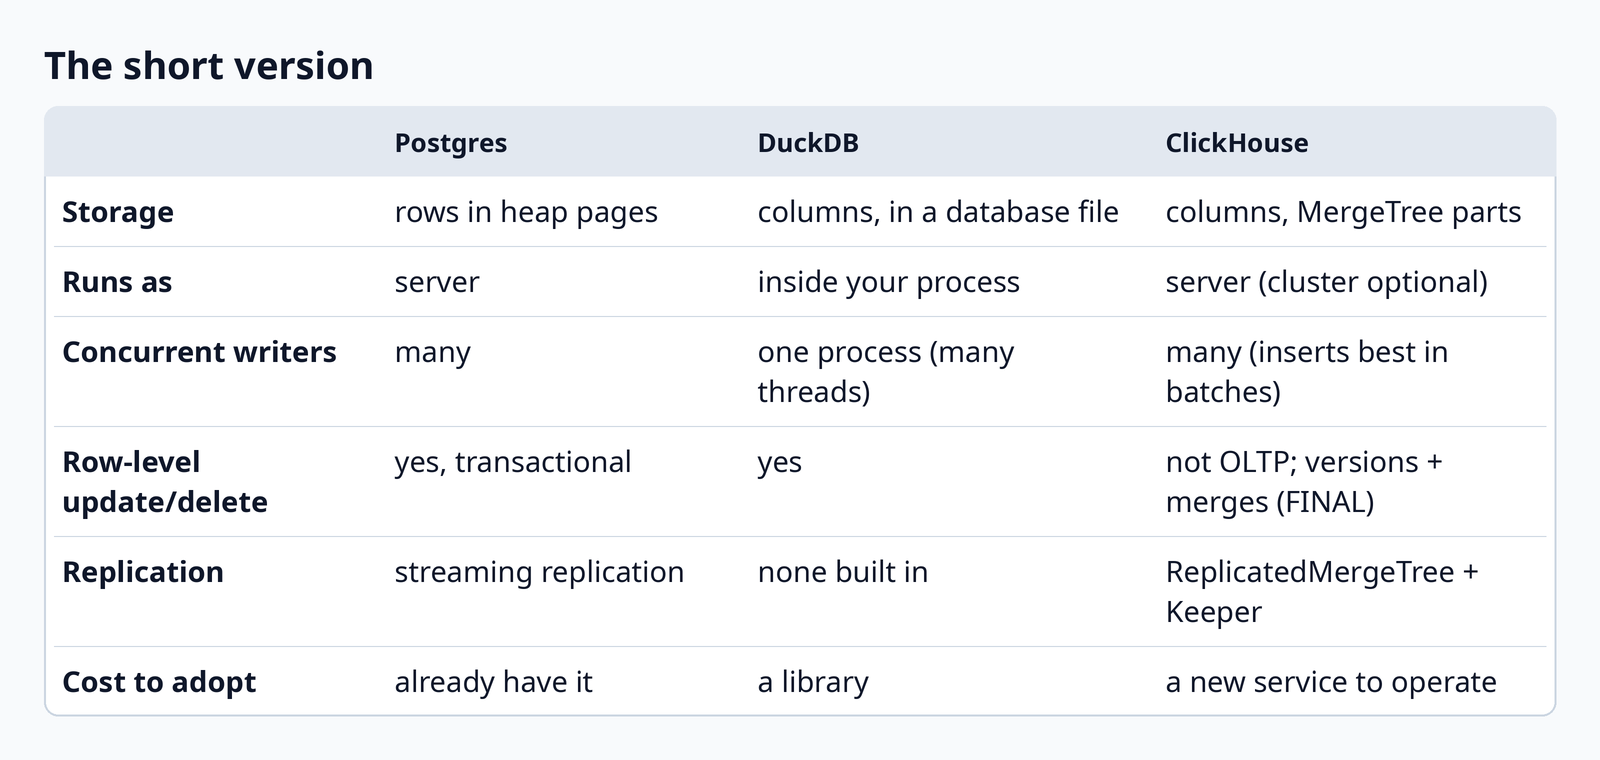
The short version
What we measured
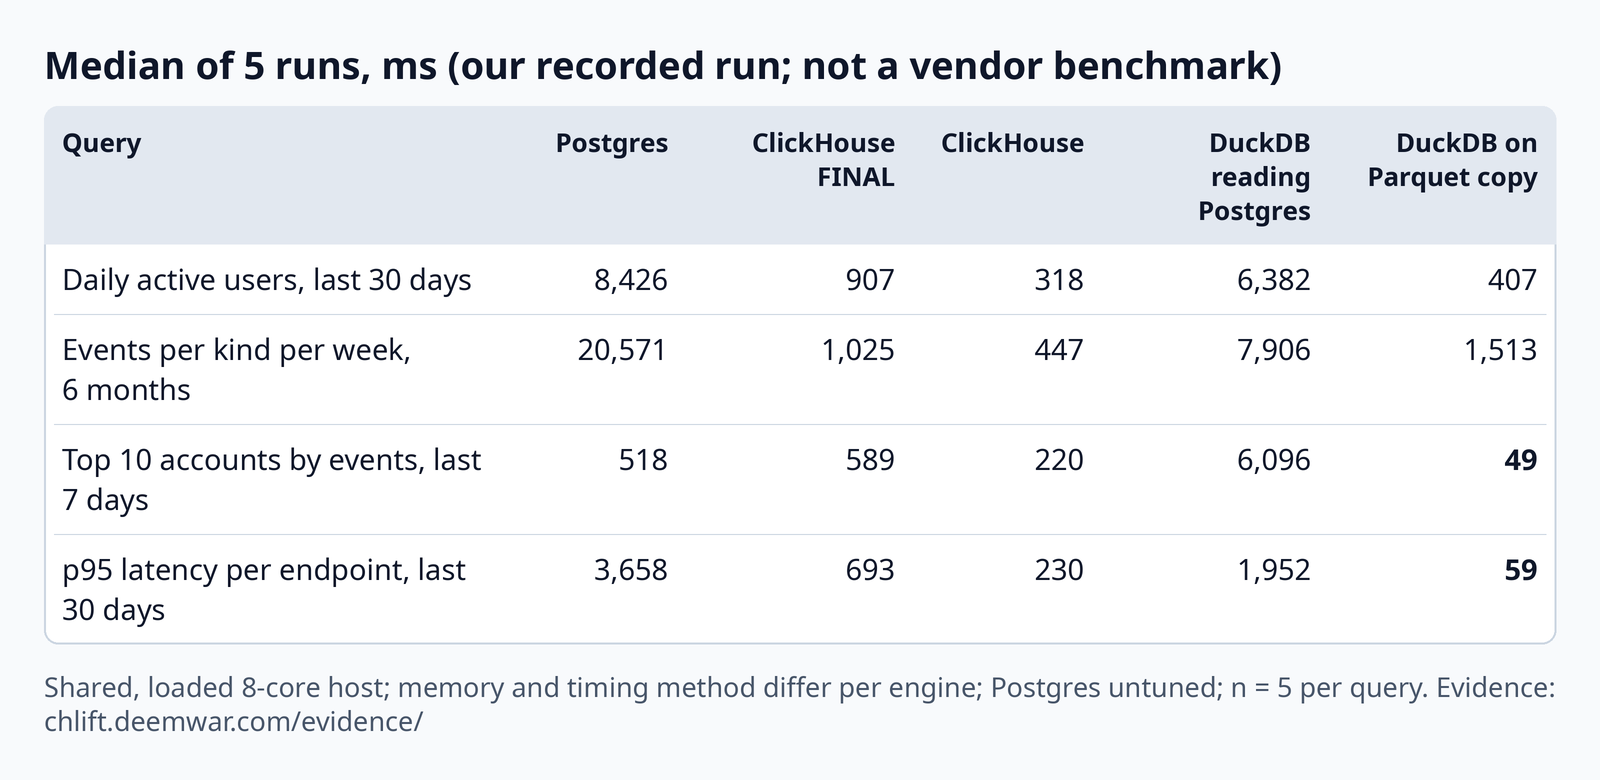
These are our numbers from our own recorded run. This is not a vendor benchmark. Every figure, caveat and the raw samples are published with chlift's evidence at chlift.deemwar.com/evidence/ (section "Postgres vs ClickHouse vs DuckDB, rerun 2026-10-04"), together with the raw samples and the script that recomputes the table.
Data: synthetic, 8,047,000 user_events rows and 4,000,000 request_logs rows, with six months of timestamps.
Method: all five columns come from one invocation: 5 runs per query, median shown.
Engines:
- Postgres 16, default settings, in a 768 MB container.
- ClickHouse: 2 replicas, 3 GB each, kept current from Postgres by CDC.
- DuckDB, two ways. Reading Postgres runs the same SQL through its
postgresextension, pulling rows from Postgres on every query. On a Parquet copy first exports the two tables to local Parquet, which took 22.8 s and produced 541 MB. DuckDB had a 2 GB memory limit on 4 CPUs.
Every query returned the same number of result rows in Postgres and in both DuckDB modes.
What it says, plainly:
- DuckDB on a Parquet copy beat ClickHouse on 2 of the 4 queries: top accounts in 49 ms against 220 ms, and p95 per endpoint in 59 ms against 230 ms. ClickHouse won the other two (daily actives 318 vs 407, weekly events 447 vs 1,513). Against Postgres, the Parquet copy was 10.6× to 62.0× faster.
- ClickHouse was 2.4× to 46.0× faster than this Postgres without
FINAL, and 0.9× to 20.1× with it.FINAL, needed for exact results while updates are still being merged, cost 2–3× here. On the short 7-day query, ClickHouse withFINAL(589 ms) was slower than Postgres (518 ms). - DuckDB reading Postgres directly was the weakest analytics option (0.1× to 2.6× vs Postgres). It still has to pull every row out of Postgres's row store, so the columnar engine has nothing to skip.
So this is not a "fastest engine" result. The real difference is what you get with the speed:
- ClickHouse here is a live, replicated cluster, kept current from Postgres by CDC. In our soak, catch-up was 10 s at the median and 281 s at p99 on a 2-core budget. It is built to serve many users at once, though we did not measure concurrency here.
- The DuckDB Parquet copy is a point-in-time snapshot in a single process. It went stale the moment Postgres changed. It has no replication and no CDC, and refreshing it is a pipeline you build.
Caveats (from the evidence file):
- Shared and loaded host: one shared 8-core server running other jobs (load average 8–23, CPU pressure 33–69%), and busier during the DuckDB part than during Postgres and ClickHouse.
- Memory differed per engine: ClickHouse had about 8× Postgres's memory (2 × 3 GB vs 768 MB). Postgres 768 MB, 3 GB per ClickHouse replica (raised from 1.5 GB after this very benchmark hit ClickHouse's memory limit), 2 GB for DuckDB.
- Timing method differed: Postgres is timed from the client, including sending the result; ClickHouse is the server's own elapsed time; DuckDB is the CLI's wall time.
- Postgres was untuned. A tuned Postgres on bigger hardware, with partitioning and indexes, would narrow the gap.
- n = 5 per query.
When each one wins
Stay on Postgres when the data is small enough or the queries are known in advance. As long as the event tables stay in the low tens of millions of rows and your dashboard queries are a fixed set, the usual moves often get you back under a second: partition by time, add a BRIN index on the timestamp, precompute rollups in a materialized view refreshed on a schedule, and run the dashboards on a replica. Where that stops working: in our untuned run, daily actives (8M-row events table, 30 days) took 8.4 s and weekly events over 6 months took 20.6 s, while p95 per endpoint (4M-row request log, 30 days) took 3.7 s and the 7-day top-accounts query about half a second. Ad-hoc questions ("break this down by a column nobody pre-aggregated") fall off the cliff first, because a rollup only answers the question it was built for. One database is also the cheapest thing to operate, and that counts.
Use DuckDB when one person or one process is asking the questions. Notebooks, ad-hoc investigations, a nightly job that writes a report, a backend endpoint that reads a Parquet export, CI checks on data. It is the cheapest option to adopt, and in our run, on a Parquet copy, it was the fastest engine on two of the four queries: pip install duckdb, attach the Postgres replica or read a Parquet dump, and you get a columnar engine with no new server. It also works well on a laptop. Where it stops: many concurrent users on a shared, always-fresh dataset. Only one process can write, there's no built-in replication, and keeping it current from Postgres becomes your pipeline to build.
Use ClickHouse when many people or services query fresh data at once. Customer-facing dashboards, observability, high insert rates, data that must arrive within seconds, more than one replica for availability. It's built as a shared server with replication and background merges. The cost is real: another system to run, memory to provision, a different update/delete model, and a migration to get the data there and keep it in sync.
A split we use: keep users, accounts and orders in Postgres; move only the append-heavy event tables to ClickHouse; use DuckDB for one-off analysis of exports.
The migration trap: rows go missing and nothing errors
The standard way to keep ClickHouse in sync with Postgres is change data capture (CDC): read Postgres's logical replication stream and replay inserts, updates and deletes into ClickHouse. chlift uses PeerDB for that. The trap is a Postgres setting most people never touch: REPLICA IDENTITY.
With the default REPLICA IDENTITY, Postgres's logical replication stream records only the primary-key columns of the old row for an update or delete (ALTER TABLE), and unchanged large ("TOASTed") values such as long text are not resent; the protocol marks them as "unchanged" (message formats). A ClickHouse target that writes a complete new row version for every change doesn't have the old values to fill in. In our run, the CDC path also failed to apply the deletes with key-only old rows. We observed that; we have not traced the exact mechanism inside PeerDB.
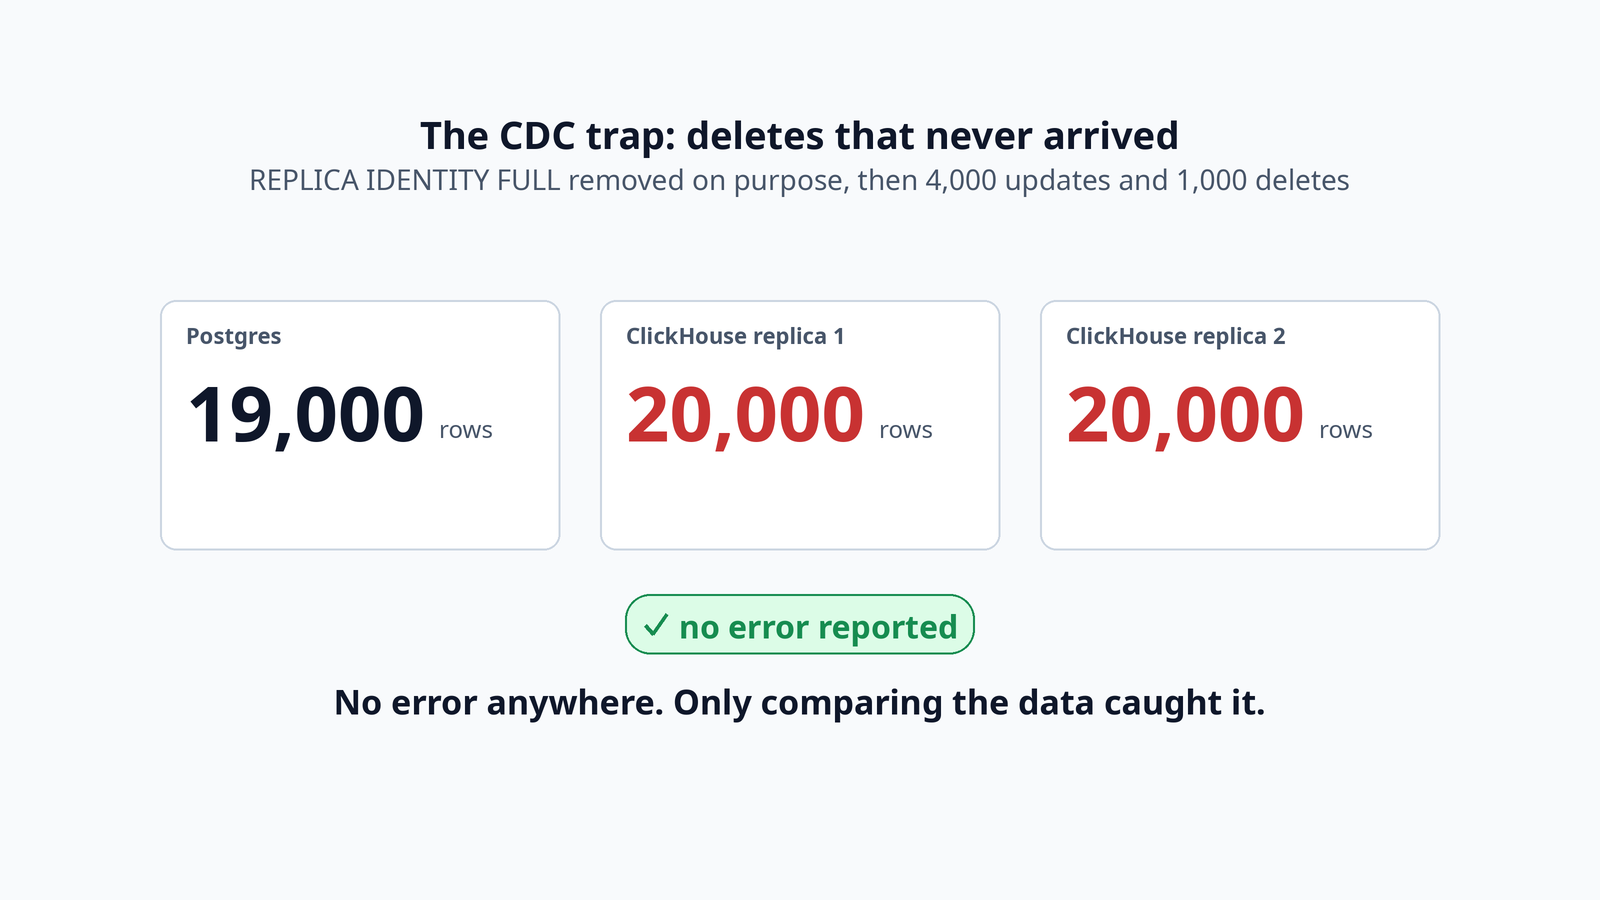
We reproduced it on purpose, on our recorded setup, by stripping REPLICA IDENTITY FULL from the tables and then running 4,000 updates and 1,000 deletes:
- Postgres ended with 19,000 rows. Both ClickHouse replicas showed 20,000: the deletes didn't land.
- Long texts arrived empty. In one primary-key range, the text came to 124,215 bytes in Postgres against 1,335 bytes in ClickHouse.
- There was no error anywhere. Nothing flagged it until the comparison step.
Then we put REPLICA IDENTITY FULL back and ran the same kind of changes: 18,000 = 18,000 = 18,000 rows in Postgres and both replicas, and 0 of 64 checksum buckets differed. (Source: chlift's evidence, rows 7–8, recorded terminal session 07-corruption-repro.)
The lesson isn't specific to our tools:
- Set
REPLICA IDENTITY FULLon every table you replicate into ClickHouse. It makes the WAL larger. That's the price. - Don't trust "replication is healthy". Compare the data. Row counts per day are the cheap first check. They miss corrupted values, so also compare checksums over key ranges: counts, ids, integers, timestamps, text lengths.
- Compare every replica, not just one.
In the same recorded run, after live CDC traffic (50,000 inserts, 1,000 updates, 5,000 deletes), the per-day counts were equal in Postgres and on both replicas for all three tables, and 0 of 64 key-range checksum buckets differed per table. (One honest gap: those checksums don't compare JSON or float columns.)
Where these numbers come from
The benchmark and the trap were recorded while testing chlift, an open-source (MIT) Postgres-to-ClickHouse migration CLI that is still in preview and needs 16 GB+ RAM per ClickHouse replica. Every number, the raw samples and what failed are at chlift.deemwar.com/evidence.
Found this useful?
Related posts
A customer clicks Cancel. How does that signal reach an ffmpeg process eight function-calls deep?
Our video pipeline does long things. A single job runs face detection at 2 fps over a 10–20 minute video, embeds every detection, clusters them by identity, then renders a focus-cropped output. Two ffmpeg shell-outs and…
We deleted the worker-watchdog container. Postgres does that job now.
In reqsume we run long-running jobs through a per-action queue — resume rewrites, PDF builds, AI chat iterations. Each job claims a row in a `jobs` table, sets `status = 'running'`, does the work, then sets `status = 'do…
A small model checking our docs was a coin flip. Giving it the docs fixed most of that.
A Hacker News thread this week argued that agents don't need memory, they need documentation ([discussion](https://news.ycombinator.com/item?id=49945933)). We had just measured a small version of that question, so here i…
You don't need a frontier model for every decision in your agent loop
That distinction is the part worth pulling out, because it maps directly onto a mistake we see in a lot of agent code: every decision point routes through the same big model, because that's the model that's already wired…